mn
mn  ru
ru 
CS2 Net Graph Guide
Tired of lag, freezes, or strange delays, and can’t figure out what’s wrong? The CS2 Net Graph command, familiar to many players since the days of CS:GO, will come to your aid. It allows you to display relevant metrics that will help you quickly troubleshoot FPS, ping, and network issues.
This guide for MelBet Pick’em contains all the current console commands, as well as instructions on how to use them. We’ll explain what really works in 2026, how to read Telemetry data, and which parameters should be enabled for regular play or lag diagnostics.
What Is Net Graph in CS2?
CS2 Net Graph is a real-time monitoring tool built into the game. It allows you to track the following metrics:
- FPS – frames per second;
- frame time – the time it takes to render each frame;
- ping – the latency between the player and the server;
- packet loss – packet loss during data transmission;
- misdelivery – problems with network data delivery;
- server performance – the stability of server data processing.
Initially, the net_graph command was used for this purpose in CS. Because of this, the command remained familiar to players, even after it was removed during the CS2 transition.
A little later, in the February 16, 2024 update, new commands and data display via Telemetry were added. As a result, the old CS:GO overlay was replaced by the modern CS2 Net Graph command system and Telemetry settings.
How to Enable Net Graph in CS2 Telemetry Settings
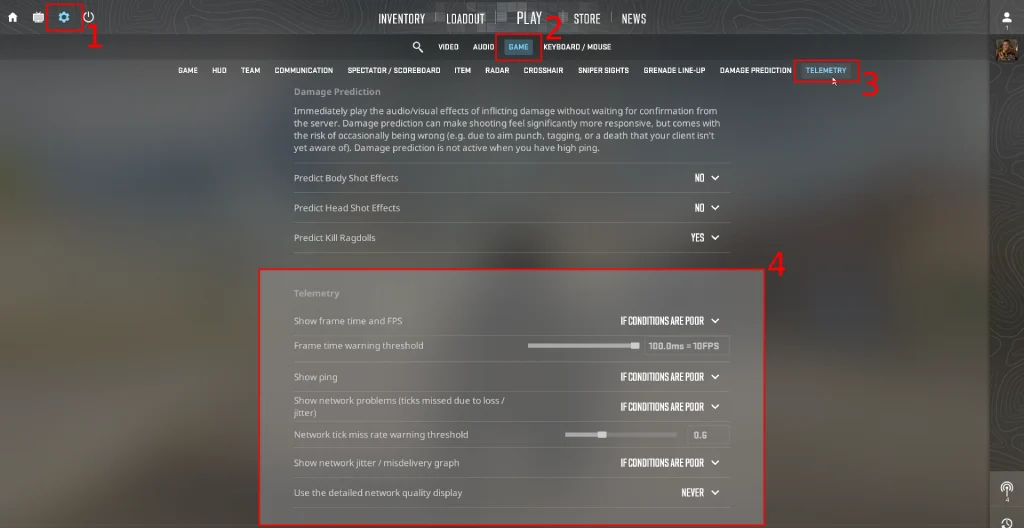
The easiest way to enable Net Graph CS2 in 2026 is to use the built-in Telemetry settings. This is convenient because it doesn’t require remembering individual commands. Simply go to the menu and select the desired metrics to display in the HUD. Detailed instructions are provided in this list:
- Open the game through Steam and wait for the main menu to load.
- Click the gear icon in the upper left corner.
- Open the Game tab.
- Scroll down to the Telemetry section.
There, you’ll see four main options. You can select one, several, or all of them, depending on your needs:
- Show Frame Time and FPS
- Show Ping
- Show Network Problems
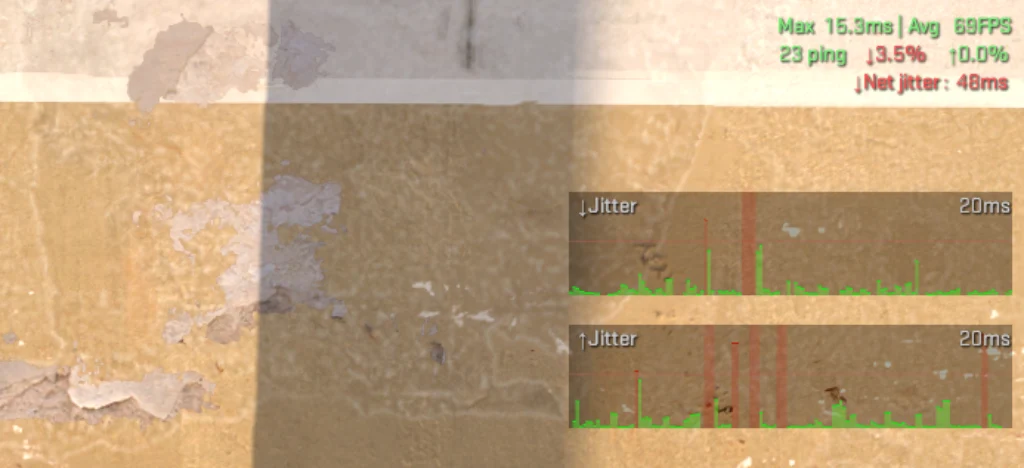
- Show Network Jitter / Misdelivery Graph
Next, enter one of the CS2 game modes, and you’ll see the telemetry in the upper right corner.
Best CS2 Net Graph Commands
In addition to Telemetry Settings, you can use console commands in CS2. Now, there’s not just one CS2 Net Graph console command, but several commands with a ton of parameters.
To use at least one of them, you need to enable the developer console. To do this, follow these steps:
- Launch Counter-Strike 2.
- Open Settings.
- Go to the Game tab.
- Find the Enable Developer Console option.
- Set it to Yes.
- In the menu or during a match, press the ~ key (or another key, depending on your console setup).
- Enter the desired command and press Enter.
In the table below, we have collected the main CS2 Net Graph commands 2026. They can be used both individually and together, except in cases where the same command is entered with different parameters.
| Command | What it shows |
|---|---|
| cl_showfps 1 | Basic FPS counter. |
| cl_showfps 2 | FPS with frame time info. |
| cl_showfps 3 | FPS and server timing data. |
| cl_showfps 0 | Turns off the FPS counter. |
| cq_netgraph_problem_show_auto 1 | Shows network issues when CS2 detects them. |
| cq_netgraph_problem_show_auto 0 | Turns off network issue warnings. |
| cl_hud_telemetry_frametime_show 2 | Shows frame time and FPS in the HUD. |
| cl_hud_telemetry_ping_show 2 | Shows ping in the HUD. |
| cl_hud_telemetry_net_misdelivery_show 2 | Shows network delivery issues. |
| cl_hud_telemetry_net_quality_graph_show 2 | Shows the jitter and misdelivery graph. |
| cl_hud_telemetry_serverrecvmargin_graph_show 2 | Shows the server receive margin graph. |
How to Read CS2 Telemetry Data
Enabling Telemetry by itself doesn’t really do anything. You need to learn how to read these metrics to see problems, not just numbers and graphs. For this purpose, we’ve prepared an analysis of each CS2 Net Graph parameter.
FPS vs. Frame Time
FPS is the number of frames per second your computer delivers. The higher this value, the smoother the game appears. However, there’s a big caveat: frame time. This is the time it takes your device to render each individual frame.
For example, a game may display a very high FPS, but if the frame time fluctuates, you’ll experience micro-stuttering. Therefore, if you have high FPS but still experience stuttering, take a look at the frame time. You might be able to stabilize it slightly by limiting the FPS in CS2 to lower values.
Ping vs. Jitter
Ping is the delay between your computer and the game server. A low value indicates that the server is receiving your actions and returning a response quickly. However, sometimes your ping is low, but you still see latency.
It’s likely that the problem is ping fluctuations, which jitter shows. For example, a stable ping of 40 ms is significantly better than constant fluctuations from 20 to 90 ms.
Packet Loss and Misdelivery
Packet loss means that some data between your client and server is lost during transmission. Even a small percentage of such losses can seriously disrupt a match.
Misdelivery is also related to network data delivery issues, but it refers to cases where packets arrive late or out of order. You can read more about how to fix packet loss CS2 in our guide. It covers the most common methods, and one of them may help you.
Server Receive Margin
This indicator shows how reliably the server is receiving your commands. An uneven graph is usually associated with issues delivering data from the client to the server.
The indicator itself can only be used to diagnose the problem. If the ping is stable and there are no problems with FPS, then problems probably arise when transmitting commands to the server.
CS2 Net Graph Not Working: How to Fix It
Have you enabled Telemetry or entered a net graph command in CS2, but the stats aren’t showing up? In most cases, something was likely set up incorrectly. The most common mistakes players make when trying to enable Net Graph in CS2 are summarized in this list:
- You’re using the old net_graph 1 command: In CS2, the classic command from CS:GO no longer works. Instead, use Telemetry Settings or modern commands like cl_showfps 1, cq_netgraph_problem_show_auto 1, and cl_hud_telemetry_*.
- Telemetry isn’t set to Always: In the Game → Telemetry section, you can select a display mode for some parameters. If it’s set to something like “Only if poor,” the data may not be displayed consistently. To test, it’s best to temporarily set the desired stats to Always.
- Commands aren’t saved after restart: If the settings reset after restarting the game, add the required commands to CS2 autoexec.cfg.
- The command was entered with an invalid value: Many new CS2 Net Graph commands operate on a 0, 1, 2 logic. That is, 0 disables the indicator, 1 shows it only when there are problems, and 2 enables constant display. Therefore, be sure to specify the exact value you need.
Best CS2 Net Graph Settings for Performance Monitoring
There are no universal “best” settings or CS2 Net Graph commands. First, ask yourself why you want to enable them. Different settings are needed for regular play and for diagnostics. For most players, we’ve outlined the optimal option in this list:
- Show Frame Time and FPS – Always: This is a basic metric; most players like to constantly monitor their FPS.
- Show Ping – Always: Ping can vary from match to match, so it’s also recommended to check it regularly. This can be done via the tab, but it’s better to enable it via CS2 Net Graph, as this can also help you track latency stability.
- Show Network Problems – Only if poor: For regular play, it’s best to enable this option only when problems appear.
- Show Network Jitter / Misdelivery Graph – Only during troubleshooting: This graph can overload the HUD. It’s simply not needed on a regular basis, so only enable it during troubleshooting.
- cl_showfps 1 – For quick FPS checks: If you need a simple FPS counter in the console, use the cl_showfps 1 command. This is convenient because you can quickly disable it by setting the value to 0.
- Telemetry commands with a value of 2 – For full monitoring: If you want to constantly see metrics in the HUD, use Telemetry commands with a value of 2. For example, cl_hud_telemetry_ping_show 2 or cl_hud_telemetry_frametime_show 2.
- Telemetry commands with a value of 1 – For a cleaner HUD: If you don’t want to clutter the screen, use a value of 1. In this mode, the metric will only appear in poor conditions, which is convenient for everyday play.
How to Turn Off Net Graph in CS2
If you’ve already resolved the freezing issues and want to keep only the show FPS CS2 Net Graph option, you can disable the other options. This depends on how you enabled them.
Disabling Net Graph in CS2 via Settings
Open Settings → Game → Telemetry and set the desired options to “Never”:
- Show Frame Time and FPS
- Show Ping
- Show Network Problems
- Show Network Jitter / Misdelivery Graph
Disabling CS2 Net Graph commands via console
Using the console is even easier. Simply enter the same commands, but with the value set to 0. The hardest part is remembering which commands you enabled. You can use our table above for this. For convenience, you can directly copy the commands with the value set to 0:
- cl_showfps 0
- cq_netgraph_problem_show_auto 0
- cl_hud_telemetry_ping_show 0
- cl_hud_telemetry_frametime_show 0
- cl_hud_telemetry_net_misdelivery_show 0
- cl_hud_telemetry_net_quality_graph_show 0
- cl_hud_telemetry_serverrecvmargin_graph_show 0
Also, don’t forget to remove the commands from autoexec.cfg, if you added them there.
FAQ
No, the old command, well-known to many players, doesn’t work after the move to CS2. Telemetry settings or separate console commands are now used.
The best way to enable the familiar Net Graph metrics is through the menu: Settings → Game → Telemetry. There you’ll see four main options; you can enable all of them together, or just one or two. You can also use the console commands from our guide, which are all summarized in the table above.
To enable the FPS counter, you can use the console command cl_showfps 1. You can also do this through the menu; in the Telemetry section, enable “Show Frame Time and FPS”.
Read also: